Viral content doesn’t just happen anymore. With an hour of video uploaded to YouTube every single second you have to work hard to ensure that your message gets through. Doing a little bit of analysis pays dividends.
Metrics – not just for page views any more
It used to be that metrics were very simple: the number of page views, the number of unique visitors, where people were coming from and at what time – you could represent most of what you wanted to know with a handful of numbers and a few simple bar graphs or heat maps.
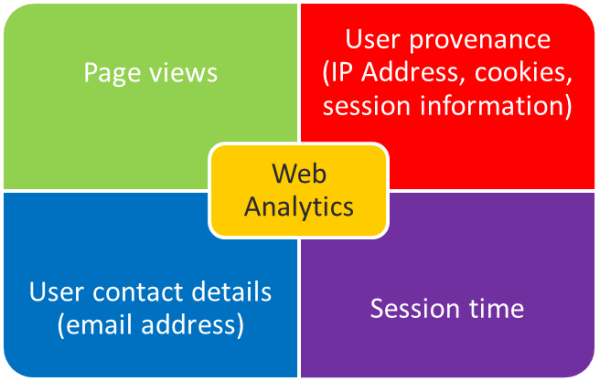
Figure 1The old days – when page views were what mattered
But in the social media world it’s not enough to know who’s visiting your site, you have to know who’s sharing your content and what it is they’re saying about it. You also need to know who you need to affect in order to get your content to go viral. And if you want to make money from users you need to be aware of the ARM funnel – the relationship between acquiring, retaining and monetising users.
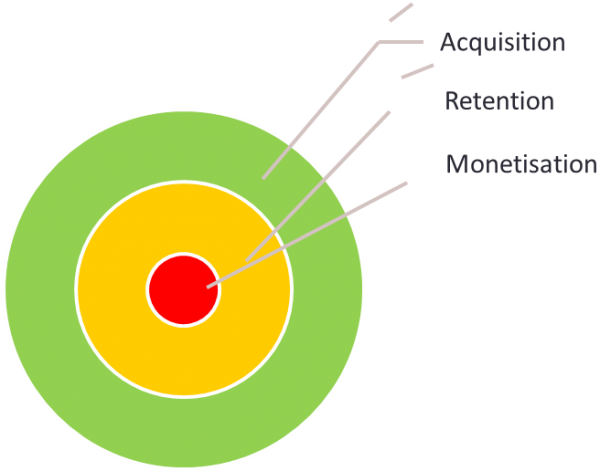
Figure 2The ARM Funnel
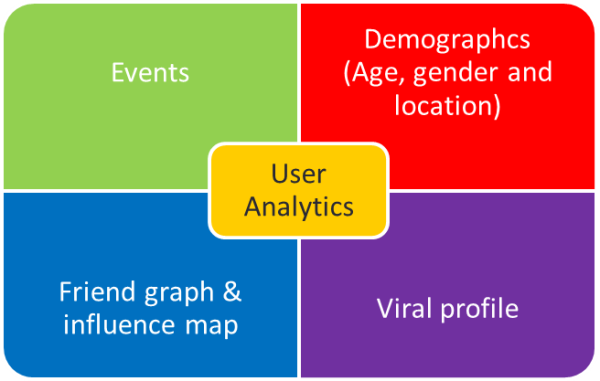
Figure 3 These days, users are what matters
Not every user that you acquire will be retained and not every user that you retain will earn you money. The statistics you need to understand for your viral are:
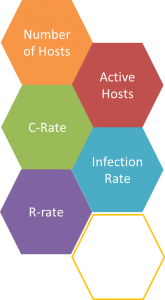
Number of hosts
Active hosts
Connectedness
K-factor (sometimes called R0) or the infection rate
Retention rate
Monetisation rate
Number of Hosts:
 This is the number of people who have been exposed to at least one link to your content, via email, Twitter, Facebook, Pinterest or any other platform. This can be a tricky statistic to measure because of the overlapping social circles of the people sharing your content – I may be exposed to the same content multiple times by different users. There’s also the difficulty of determining the identity of a single entity: how do you avoid double counting users with different Twitter and Facebook handles. Measuring exposure platform by platform and estimating the amount of overlap and duplication makes for a reasonable heuristic measure of the number of hosts.
Active hosts:
 This is the number of users that has actually interacted with your content. More-or-less equivalent to “unique visitors” – this statistic tells you how far your content has travelled. However, it’s highly likely that successful viral content will be rehosted and re-replicated on different platforms by your users. In this case you need a tool like Vidmetrix to keep an eye on the many potential clones of your content. You should also be encouraging users to make derivative works based on your viral content. Vidmetrix can track those too.
Connectedness
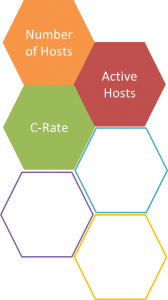 One of the key descriptive statistics of any graph is the degree of connectedness of the average node. Understanding how well connected your active hosts are is very informative, as it gives you an idea of how many hosts they can potentially expose to your content. The more well-connected a node is, the more valuable to you it will be. Identifying “promiscuous” nodes can help you to seed your viral content.
The Facebook Query Language (FQL) for example can be used to query user details and discover the size of their social network and the groups they belong to. You can use this data to “push” updates preferentially to these nodes.
Infection Rate
 The infection rate (R0 or K-factor) is the number of people each user “infects” on average. This statistic comes from (biological) epidemiology and is used to determine whether or not a disease will become an epidemic or will burn itself out.
If the infection rate is 1, that means that every person who is an active host will infect one other person. This is a “replacement rate” or “steady state” level of infection and the amount of exposure to your content/infected cases in the population will not change over time.
Of course an infection rate of exactly 1 is exceptionally rare. Instead the infection rate is usually either above or below that level.
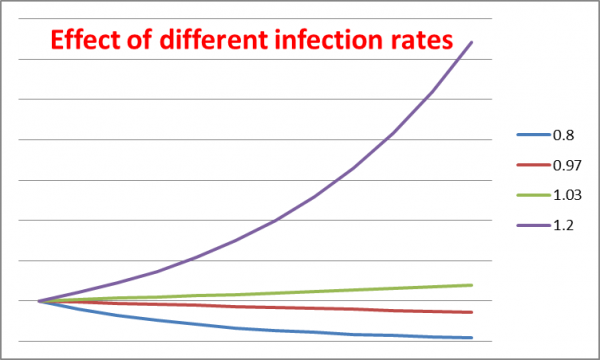
The chart shows the effect of different infection rates. At levels below 1, the number of cases (or users) steadily declines. At levels above 1 the number of cases grows. At sufficiently high rates (levels above 1.14) growth becomes “hot” or “runaway” and you have a viral success!
Retention rate
 However, viral success isn’t the same as business success. It may be that each active host only visits your page once and never returns. If your strategy depends on you monetising your content then this is no use at all. The retention rate statistic tells you how often users return to your content some specified time period after their first exposure. You can measure retention in days, weeks, or even months depending on the sort of monetisation strategy you’re looking for.
Monetisation rate
 This is the biggie – the statistic that tells you if your viral strategy is paying off. Not every user is going to be a paying user. Some will never progress beyond your free content and into the realms of paid-for products. You need to measure how many users make it from initial exposure to paying customers. Estimates suggest that conversion rates from exposure to infection (number of hosts to retained users) is around 5% and monetization rates are usually around 3%, rising to around 20% for the most active users. This means that of 1,000 invitations, 30 might play your game regularly and between one and six people may become paying customers.
As with all marketing channels, the key metric is cost of acquisition per unit of profit. Some of the statistics you will gather will need to be estimates, but use the social metric tools at your disposal to be sure that your viral strategy is really paying off.
Searching for a New Web Host? Then be Sure to Checkout Dedicated Hosting Reviews and Windows Hosting Reviews at WebHostingReview.info Before You Choose Your New Web Hosting Service Provider.


[…] Understanding virality in context of other impacting metrics, from socialh.com […]