Infographics or data visualization is becoming a popular format for presenting critical data to a target audience in way that is instantly understandable and engaging. This is why infographics have scaled the popularity charts and become an important content format that has immense marketability. The fact that they are immensely eye catching and deliver information in a variety of enthralling ways means, they are here to stay. Users will never tire of going through infographics that offer them useful information that is presented to them in a really interesting way.
The keyword is ‘useful’ and ‘interesting’. Infographics work only if they are good and for that to happen you need to follow certain best practices.
Let’s take a look at what these are:
Useful content is Needful Content
What users find useful is dependent on their need. So identify their need, as in some information they are looking for, desperately. More importantly, it must be the kind of information that can be broken down visually. Not all data can be visualized. The best information (data) is one that is packed with facts and figures. Such information is best suited for infographics.
Think it Out Before you Begin
Wireframe your infographic before you actually begin the process of designing it. You may have an idea in your head that you think fits the bill for an infographic, but as you start wireframing it, you will realize it wasn’t such a good idea after all! You need to wireframe the infographic because it gives you leeway to reorganize your design if you think your infographic idea is not working out. A wireframe can go through endless revisions, a liberty that you don’t have when you are actually designing the infographic. While wireframing, you can keep sorting your design elements and the color palette till you think it makes sense, and only then get started on the design.
It must be all Show, No Telling
I seen plenty of infographics that are wordy, meaning they make people read through the infographic. Such data visualization never works, because a good infographic is one that is all about the visuals. It must be seen, assimilated and understood. The focus must be on presenting information visually and not textually. Think of an infographic as a story that needs to be told visually. A person must be able to quickly take a look at the data presented in the infographic and be able to make sense of it. To check whether an infographic works visually or notis to check whether it grabs attention even in the absence of text. If it works, you have got a good infographic on your hands; if it doesn’t, you need to put some more effort into it.
Don’t Lose Steam Going Down
There are plenty of infographics that start out with a bang but end in a whimper. There are two reasons for this; the first is the petering out of the passion of designers as they approach the middle of the infographic and second is the lack of interesting data. All the important and eye catching data is used in the first half of the infographic and what comes latter is just fluff. This is something that needs to be avoided at all costs. Don’t lose steam as you continue designing down the page. If you do, you will end up designing an infographic for the heck of it, leading to data visualization that has more downs than ups.
Always think about Breaking Monotony
As I mentioned before, you are telling a story with your infographic. This story usually has a vertical flow, and is divided into various sections; and most sections have a heading that distinguishes it from the earlier section. Now, this isn’t a bad way of designing an infographic, but it isn’t a great way either. Remember, your infographic is going to face stiff competition, and if you want it to deliver results, you must think out of the box. Think of different ways in which you can present the information. You can think of making use of innovative borders to differentiate one section from the rest and not use a heading to distinguish each section; or you could use a different texture for each section or use a variety of colors or think of something else that helps lend a sense of uniqueness to your infographic.
The only rule that you need to follow while designing an infographic is that it must make sense to the viewer. Other than that, thinking out-of-the-box rules. You need to do everything possible to make sure your infographic stands out from the crowd.
Let’s take a look at some infographics that will offer you the much needed inspiration:

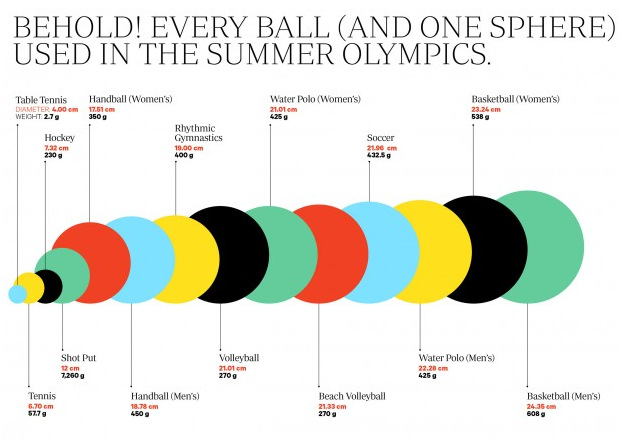
Think a simple yet eye catching infographic to get inspired from, and this one fits the bill perfectly. It’s interesting and its simple concept is taken to another level through a bare bones design.
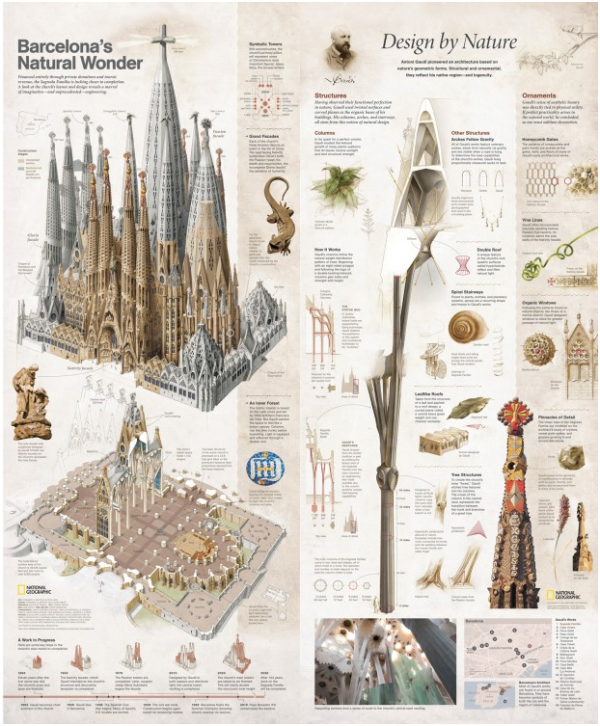
If the first infographic was an exercise in simplicity, this infographic is a visual extravaganza. Created by Fernando Baptista, it helps readers understand the symbolism and meaning behind the design of the Sagrada Familia.
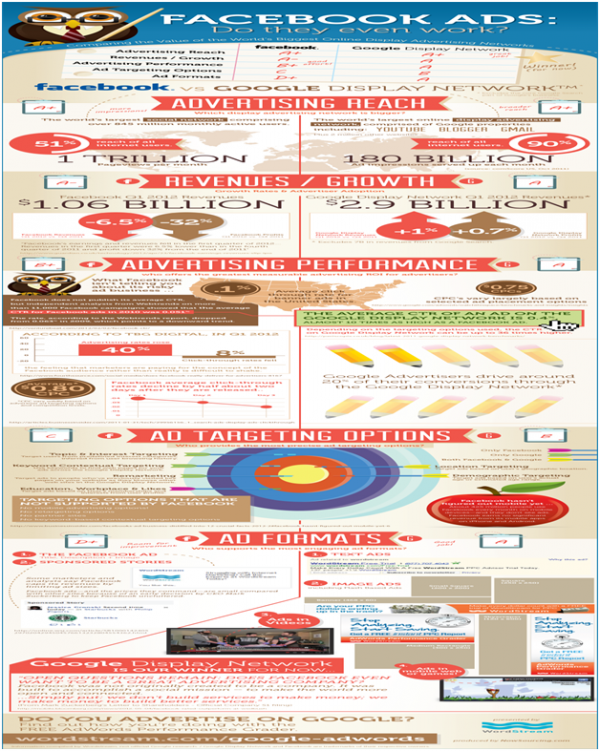
This one is packed to the brim with information, but it has visualized this information to perfection. It doesn’t follow one designing style, but a collection of them to deliver impact. More importantly, all the information can be scanned easily; soin spite of all the detailing, the information can be grasped quickly.
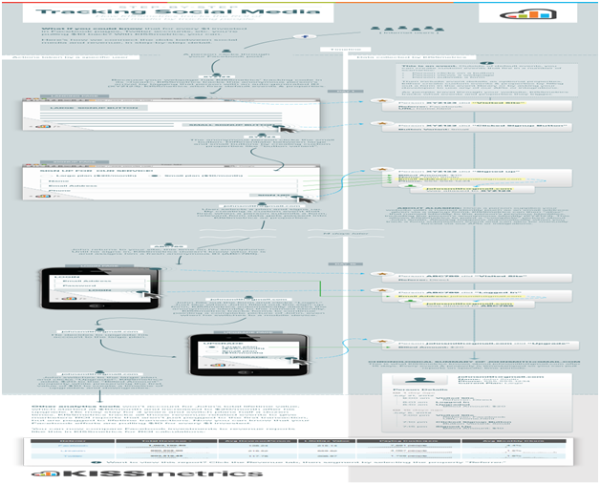
And finally, we end the list of inspirational infographics with one from Kissmetrics. The reason why this is on the list is to showcase how even a text heavy infographic can be made to work.
Conclusion
Hopefully, these best practices and inspiration will allow you to come up with a superlative infographic. Just keep one thing in mind while designing an infographic – It must offer information that its target audience will love going through. That’s it. If you keep this fact in mind, there is no reason why you shouldn’t be able to come up with an infographic that is interesting and visually exciting.
John Siebert is the President and CEO of TranquilBlue – A Tampa Website Design Company that focuses on all kind of website design, mobile app development and search engine marketing.