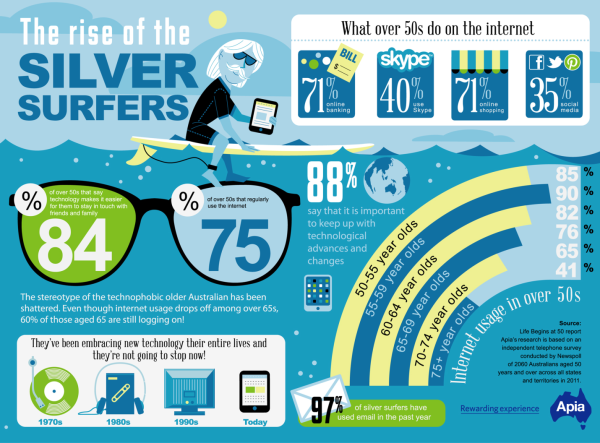
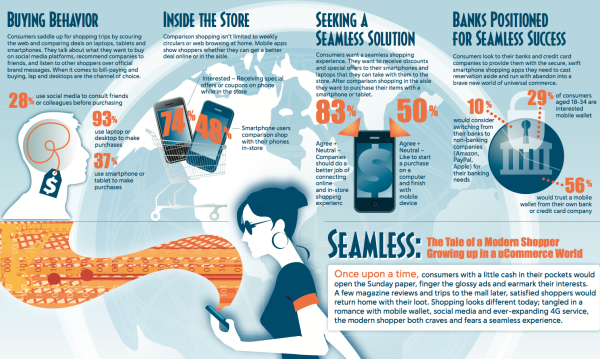
Infographics are all the rage over the internet these days. It is a visual image that represents information in a visually intriguing from.
The readers are quite besieged with the graphical content and infographics have emerged as a popular method for this purpose. The infographic search on Google has increased over 300%, and the rate of production is increasing by 1% every day.
So, what transforms an image from a graphic to infographic? What are the elements that make infographics interesting and engaging?
A successful infographic design should illustrate information clearly and instantly. It should be engaging as infographics hold immense potential to drive traffic to your website.
If you are designing an infographic for your business, here are the five key elements that will help you ace it. Take a look.
- Use Informative Data
While designing an infographic, make sure that data originates from a credible resource and is informative. The infographic should include a unique perspective that makes maximum online impact.
Your goal should be to engage the audience, and the best way is to cite your resources.

Source: Pinterest
- Tell A Story
An infographic representing your business should not consist of unconnected or random effects that are not engaging. The thing that differentiates graphics from infographics is the way the story or facts are represented.
Answer an interesting question to take hold of the audience and use as little text as possible in a clear font.
Your infographic should be represented in a hierarchal manner and through it; you should be able to represent the notion of your business.
- Make It Visually Attractive
The visual element of an infographic includes the layout, representation of data, color palette, and the typography.
Before you design your infographic, make sure you arrange these parameters in a proper way along with the intent of the graphic, and a call to action. There are many infographic tools online that make designing infographics a breeze.

Credit: Ink Harmony
- Use The White Space For Representation
Space is as important as the information you are representing adjacent to it. Infographics contain the heavy text of elements, large design, and a lot of information in very small space.
When you design it, emphasize the white space for representation but do not board the overboard the overall design.
The data should be represented in a hierarchal manner and the white space must be used as the natural pausing points.
- Size, Source, and Shareability
The optimized size for an infographic is 735 pixels. In terms of length, it should not be too long as well. If the infographics takes a lot of time to load due to a large size, the audience might lose interest and skip to something else.
Provide an embed code with image and make it easy to share so that the influencers can distribute it easily.
The Bottom Line
Adding an infographic to your marketing strategy is an effective way to engage the audience.
Take heart these tips and make sure that your infographic design is successful and works for your business.


